
2. OASE management
2.1. Introduction
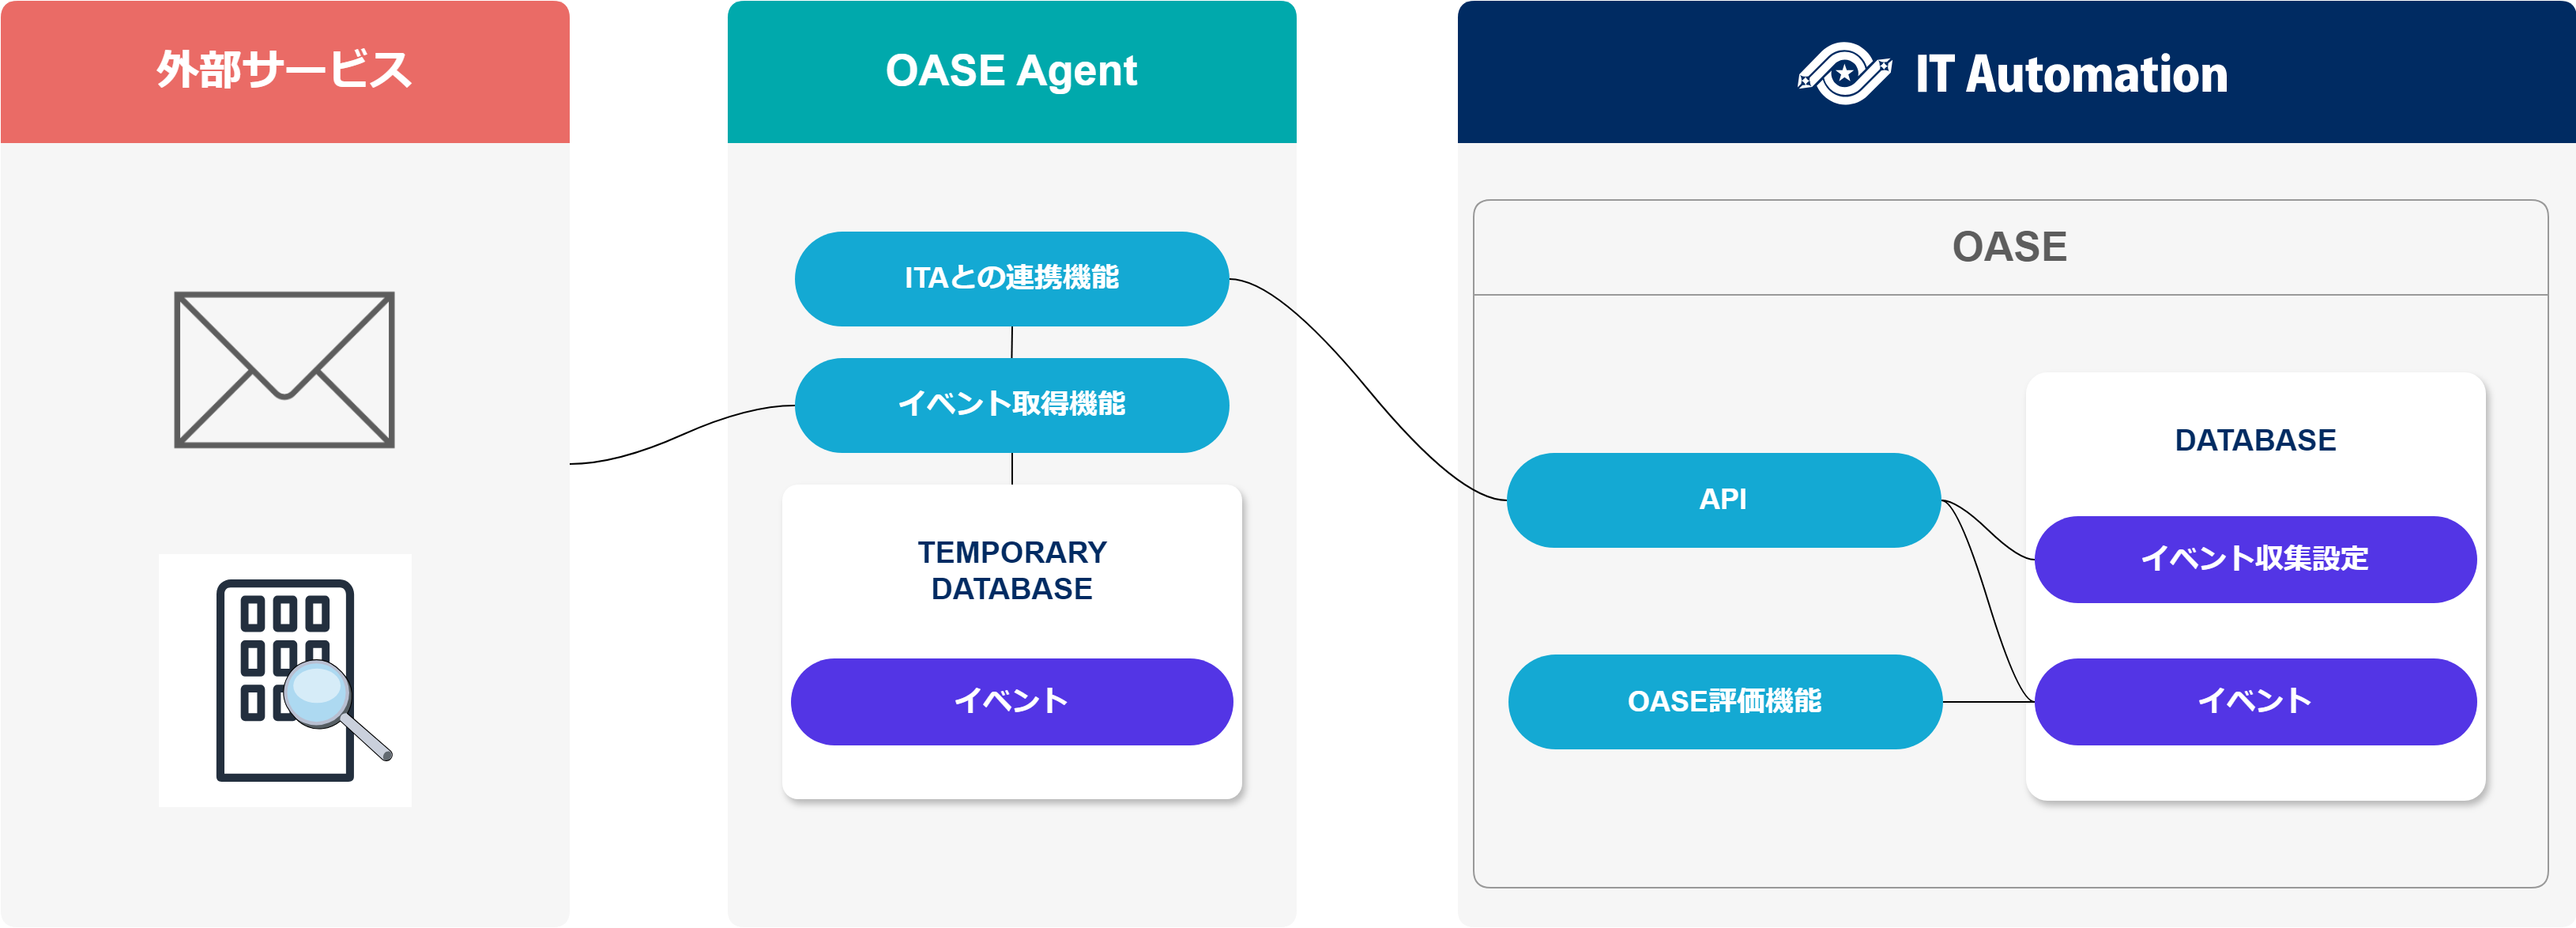
2.3. Agent overview
2.3.1. Agent
2.4. How to use the Agent
2.4.1. Workflow
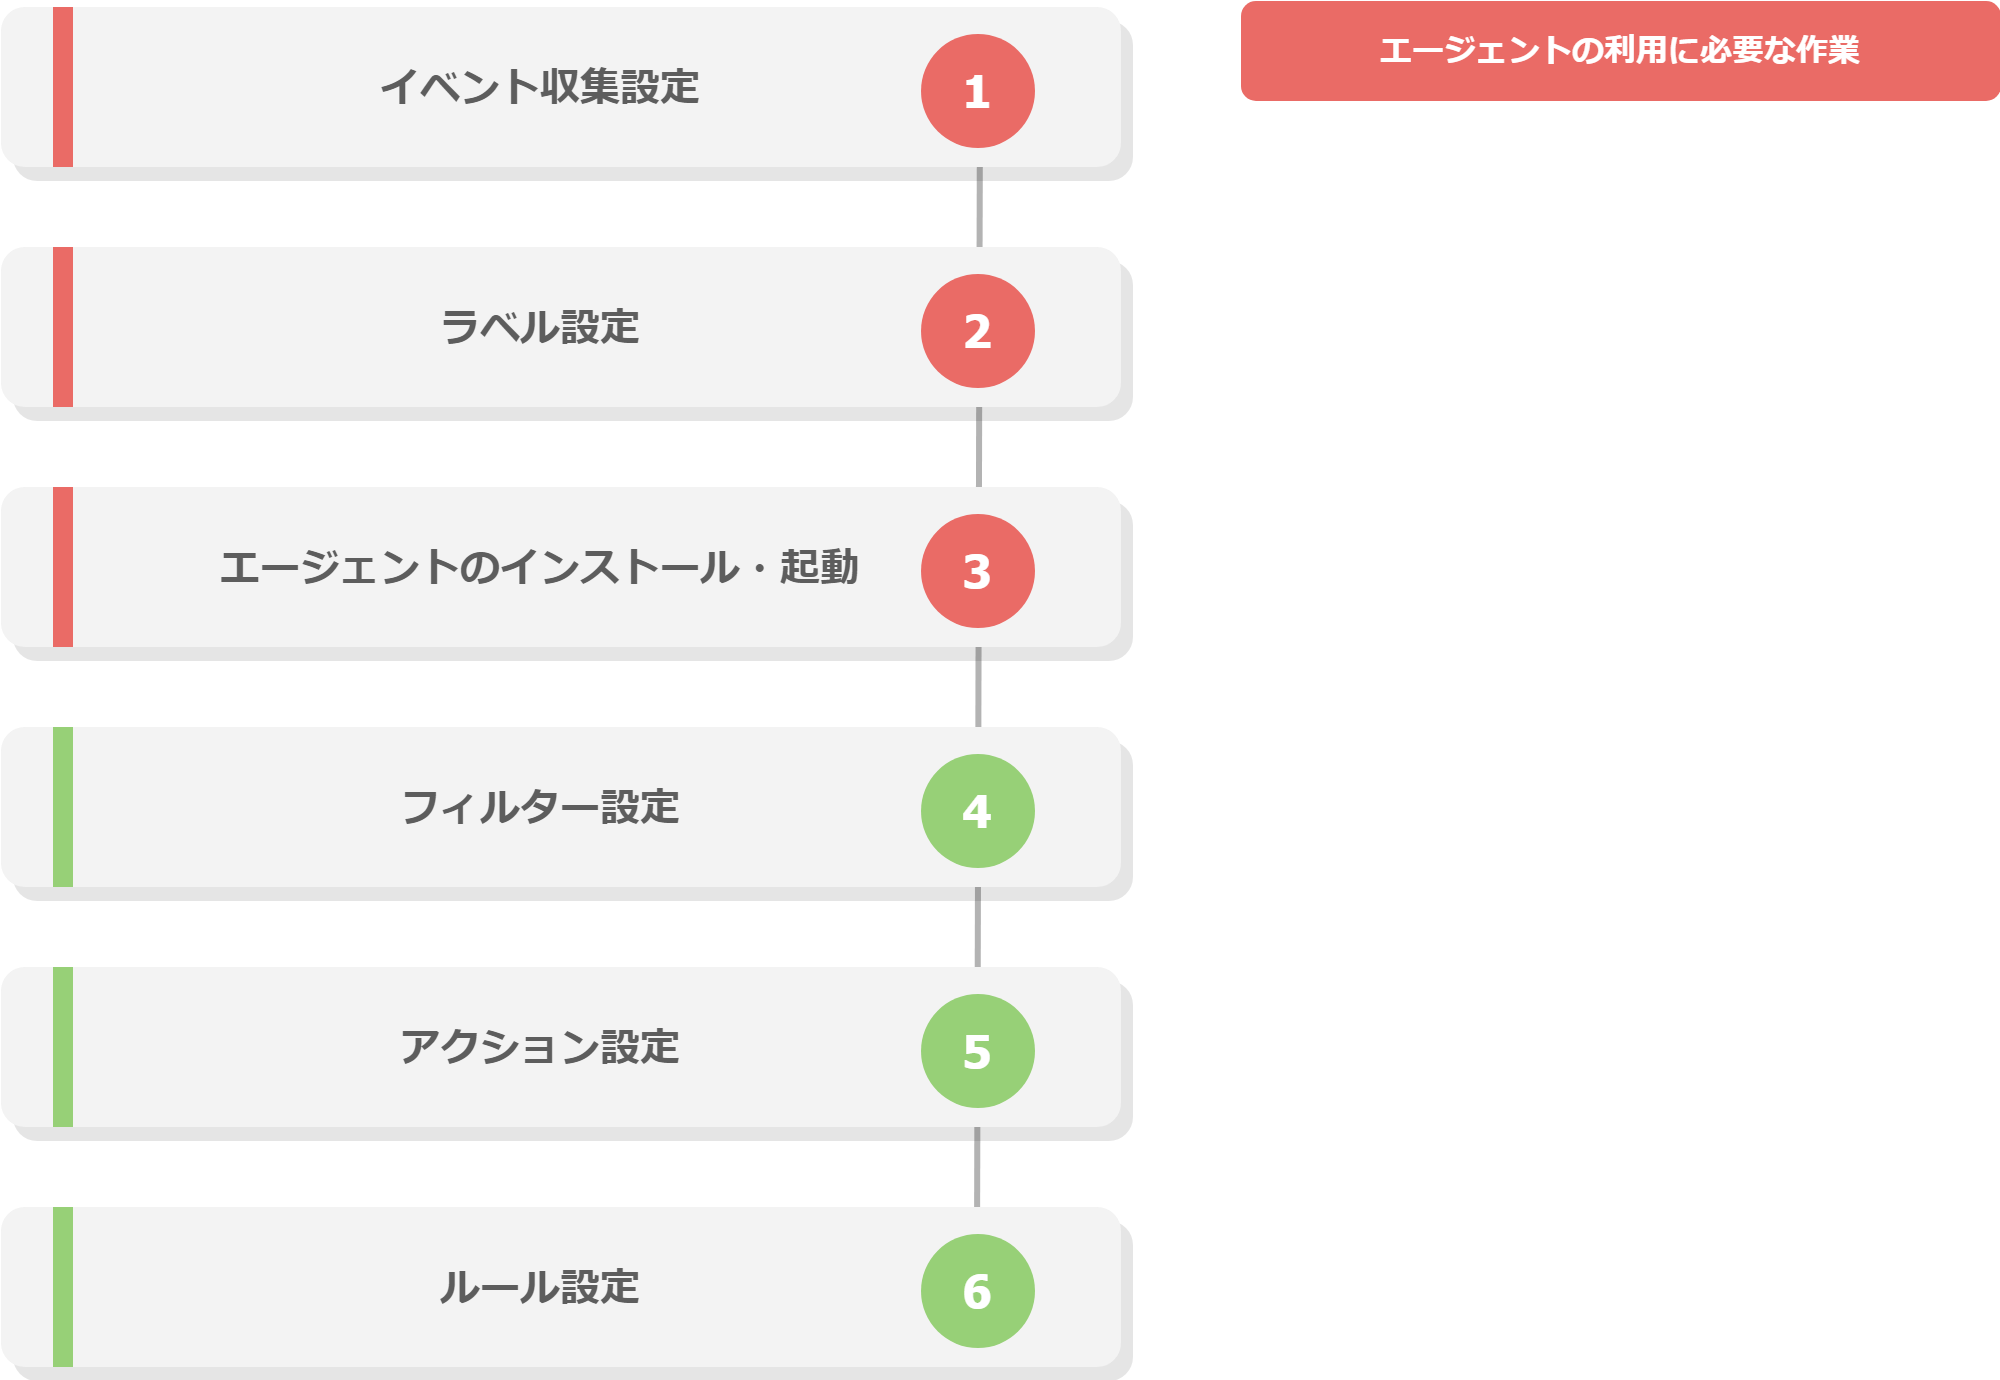
Workflow details and references
- Configure Event collection settingsIn the OASE management's Event collection menu, register settings related to the Event collection target services.
- Configure labelsIn the OASE Label creation/Labeling menu, configure settings for labeling events OASE.For more information, see Create label and Labeling.
- Install and start the AgentStart the Agent and collect Events.For more information, see Installation guide (Docker Compose).For more information, see Installation guide (Kubernetes).
2.5. Notification template (common) overview
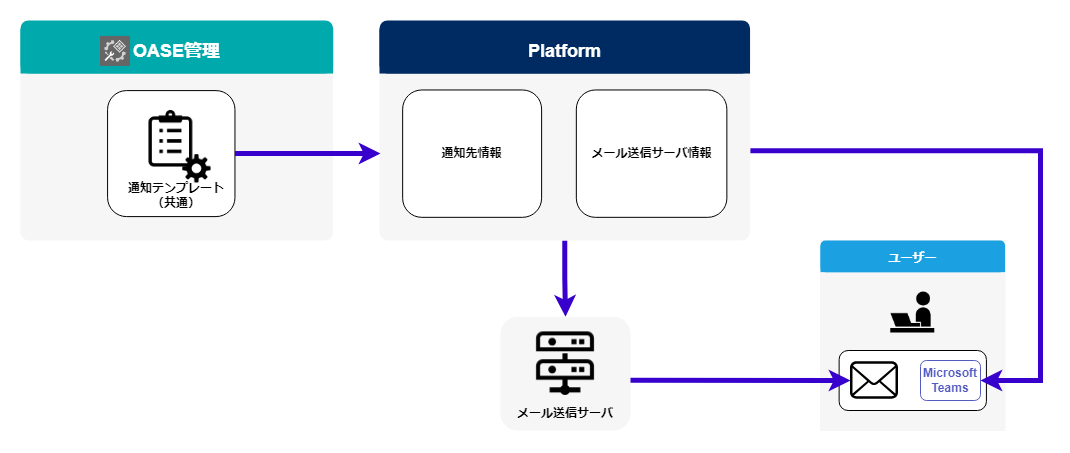
図 2.72 Notification template (common) overview
2.6. How to use Notification template (common)
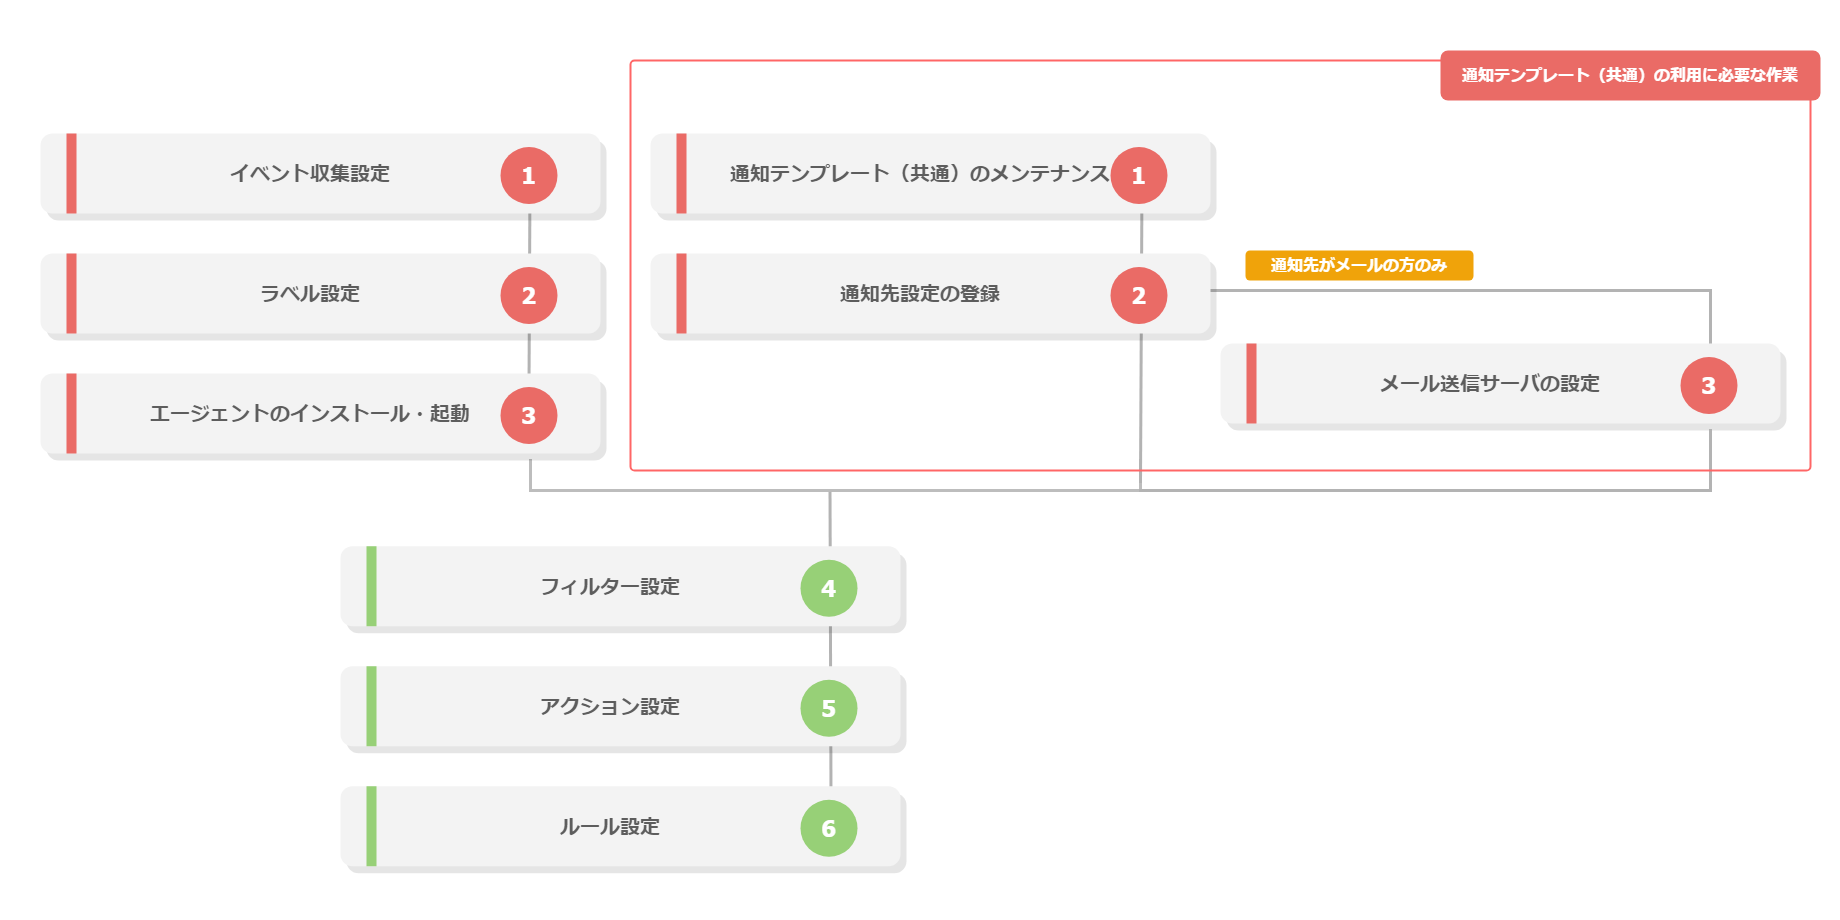
図 2.73 Notification template (common) workflow
Workflow details and references
- Maintaining (View/Edit)Notification template (common)From the OASE Management's Notification template (common) menu, users can maintain (view/edit) templates used by the OASE Notification function.For more information, see Notification template (common).
- Registering Notification settingsLog in to the Exastro system as the Organization administrator and register notification settings from the menu.For more information, see Registering Notification destination settings.
- Configure Mail server(only for cases where the notification destination is set to a mail address).Log in to the Exastro system as the Organization administrator and register mail server settings from the menu.For more information, see Mail server settings.
注釈
2.7. Function menu operation
2.7.2. Event collection
- In , users can maintain (view/register/edit/discard) TIL, connection methods, authentication methods, event collection targets, etc.
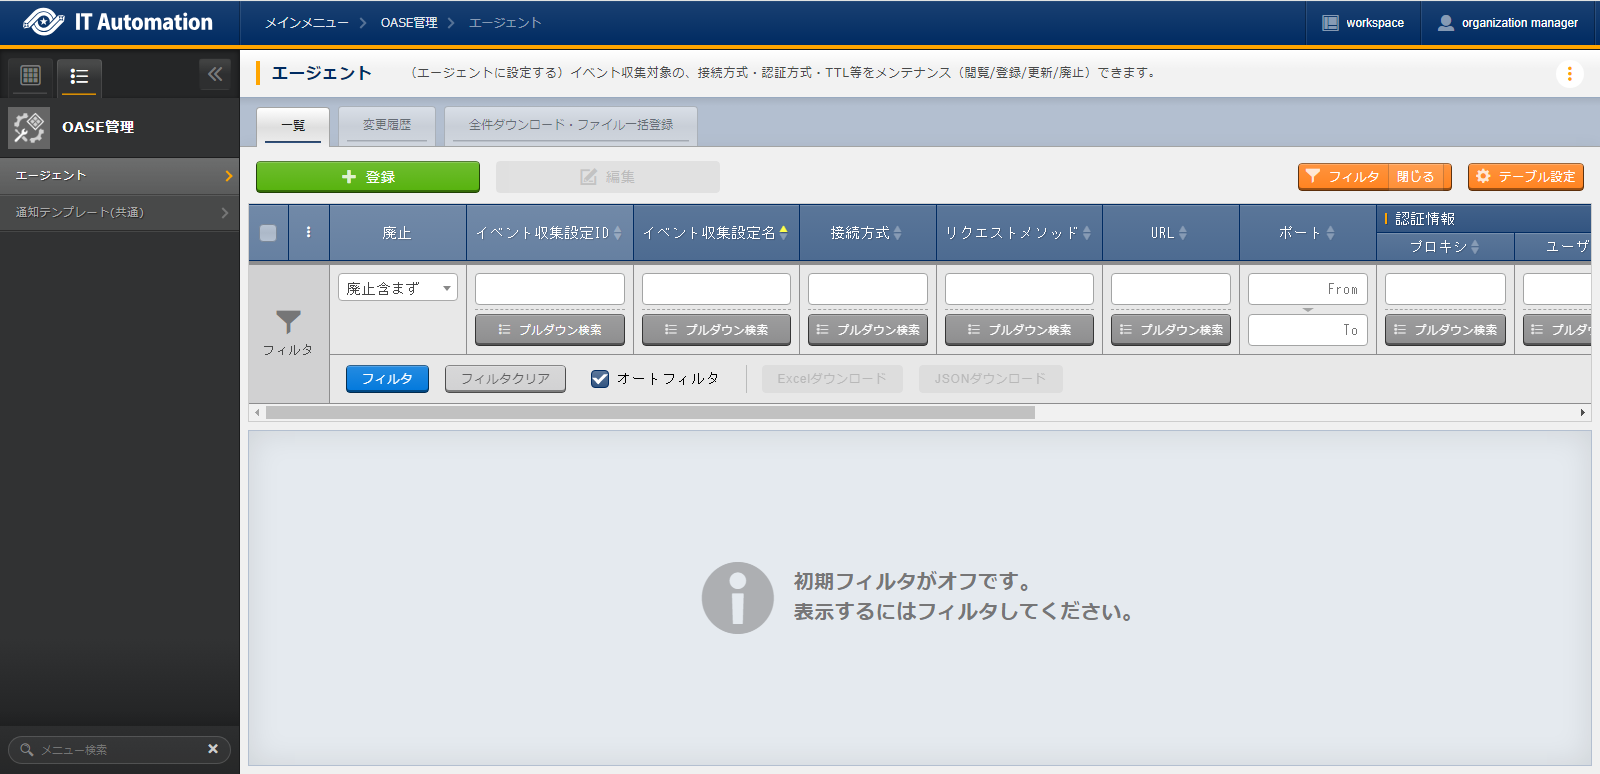
図 2.74 Submenu (Event collection)
- The Event collection※1 page's input items are as following.
Connection method |
Request method |
Authenticatio information |
|---|---|---|
IMAP password authentication |
・IMAP: Plaintext |
・Username
・Password
|
Bearer authentication |
・GET
・POST
|
・Authentication token |
Password authentication |
・GET
・POST
|
・Username
・Password
|
Free authentication |
・GET
・POST
|
・Input to Parameter |
警告
2.7.3. Notification template (common)
- In the menu, the user can maintain (view/update) template used by the OASE notification function.
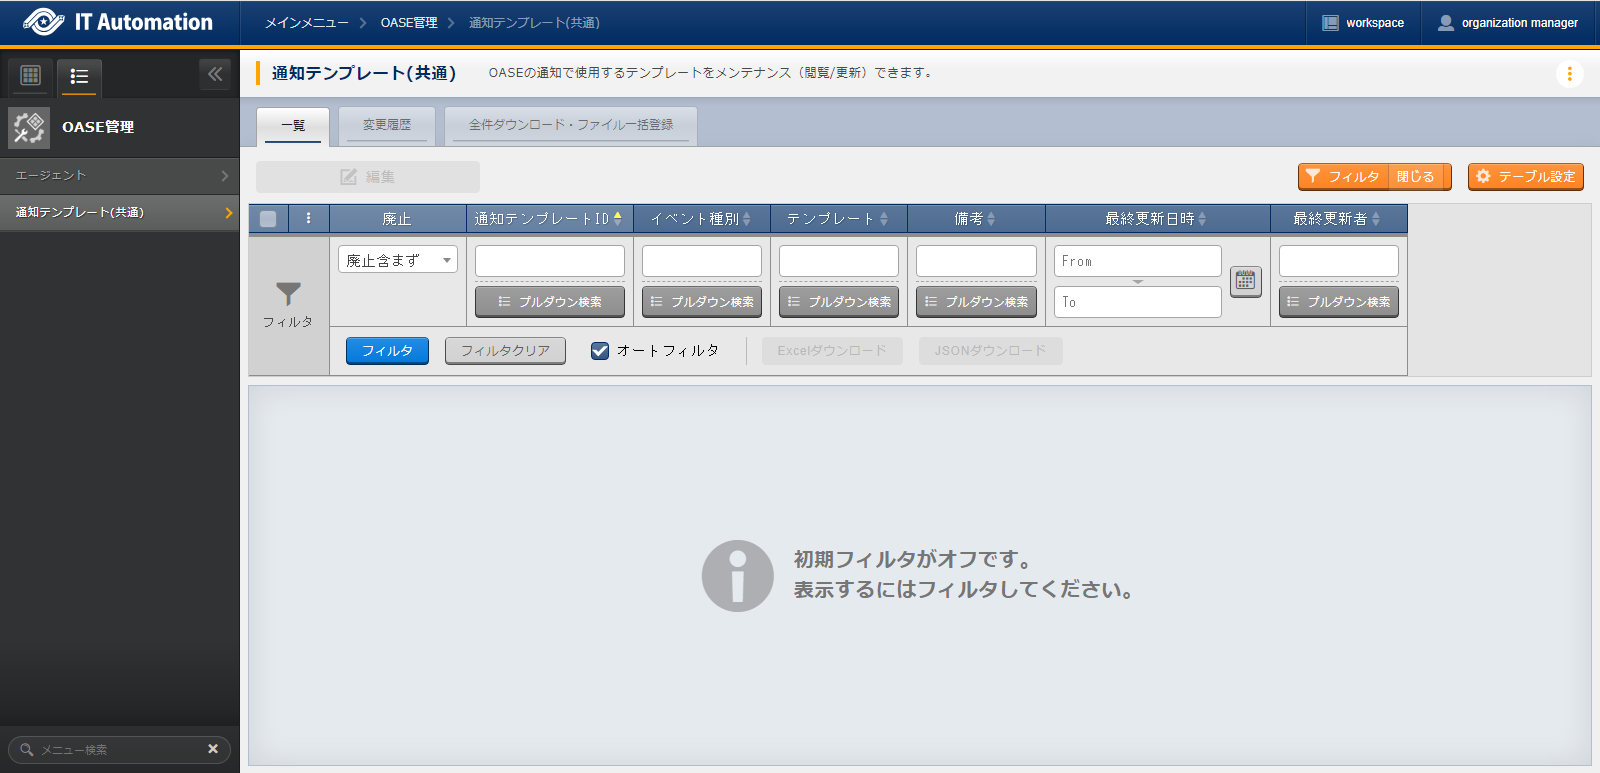
図 2.75 Submenu (Notification template (common) )
- The items found in the Notification template (common) page are as following.
Item |
Description |
Input required |
Input method |
Restrictions |
|---|---|---|---|---|
Template |
Allows the user to edit the Notification template. The types are the following 4.
・New.j2
・Known(evaluated).j2
・Known(timeout).j2
・Undetected.j2
|
〇 |
Manual |
Maximum size 2MB |
Remarks |
Free description field. |
ー |
Manual |
Maximum length 4000 bytes |
 1 [TITLE]
 2 A new event has occured.
 3
 4 [BODY]
 5 Detailed information
 6  Event ID                 : {{ _id }}
 7  Event collection settings: {{ labels._exastro_event_collection_settings_id }}
 8  Event fetch time         : {{ labels._exastro_fetched_time }}
 9  Event end time           : {{ labels._exastro_end_time }}
10  Event type               : {{ labels._exastro_type }}
11
12  Re-evaluation
13   Evaluation rule name   : {{ labels._exastro_rule_name }}
14   Event                  : {{ exastro_events }}
15
16  Label:
17    {% for key, value in labels.items() %}
18   ・{{ key }}: {{ value }}
19   {% endfor %}
 1 [TITLE]
 2 A known(evaluated) event has occured.
 3
 4 [BODY]
 5 Detailed information
 6  Event ID                 : {{ _id }}
 7  Event collection settings: {{ labels._exastro_event_collection_settings_id }}
 8  Event fetch time         : {{ labels._exastro_fetched_time }}
 9  Event end time           : {{ labels._exastro_end_time }}
10  Event type               : {{ labels._exastro_type }}
11
12  Re-evaluation
13   Evaluation rule name   : {{ labels._exastro_rule_name }}
14   Event                  : {{ exastro_events }}
15
16  Label:
17    {% for key, value in labels.items() %}
18   ・{{ key }}: {{ value }}
19   {% endfor %}
 1 [TITLE]
 2 A known(timeout) event has occured.
 3
 4 [BODY]
 5 Detailed information
 6  Event ID                 : {{ _id }}
 7  Event collection settings: {{ labels._exastro_event_collection_settings_id }}
 8  Event fetch time         : {{ labels._exastro_fetched_time }}
 9  Event end time           : {{ labels._exastro_end_time }}
10  Event type               : {{ labels._exastro_type }}
11
12  Re-evaluation
13   Evaluation rule name   : {{ labels._exastro_rule_name }}
14   Event                  : {{ exastro_events }}
15
16  Label:
17    {% for key, value in labels.items() %}
18   ・{{ key }}: {{ value }}
19   {% endfor %}
 1 [TITLE]
 2 An unknown event has occured.
 3
 4 [BODY]
 5 Detailed information
 6  Event ID                 : {{ _id }}
 7  Event collection settings: {{ labels._exastro_event_collection_settings_id }}
 8  Event fetch time         : {{ labels._exastro_fetched_time }}
 9  Event end time           : {{ labels._exastro_end_time }}
10  Event type               : {{ labels._exastro_type }}
11
12  Re-evaluation
13   Evaluation rule name   : {{ labels._exastro_rule_name }}
14   Event                  : {{ exastro_events }}
15
16  Label:
17    {% for key, value in labels.items() %}
18   ・{{ key }}: {{ value }}
19   {% endfor %}
2.8. Appendix
2.8.1. OASE Agent operation flow and ".env" setting Values
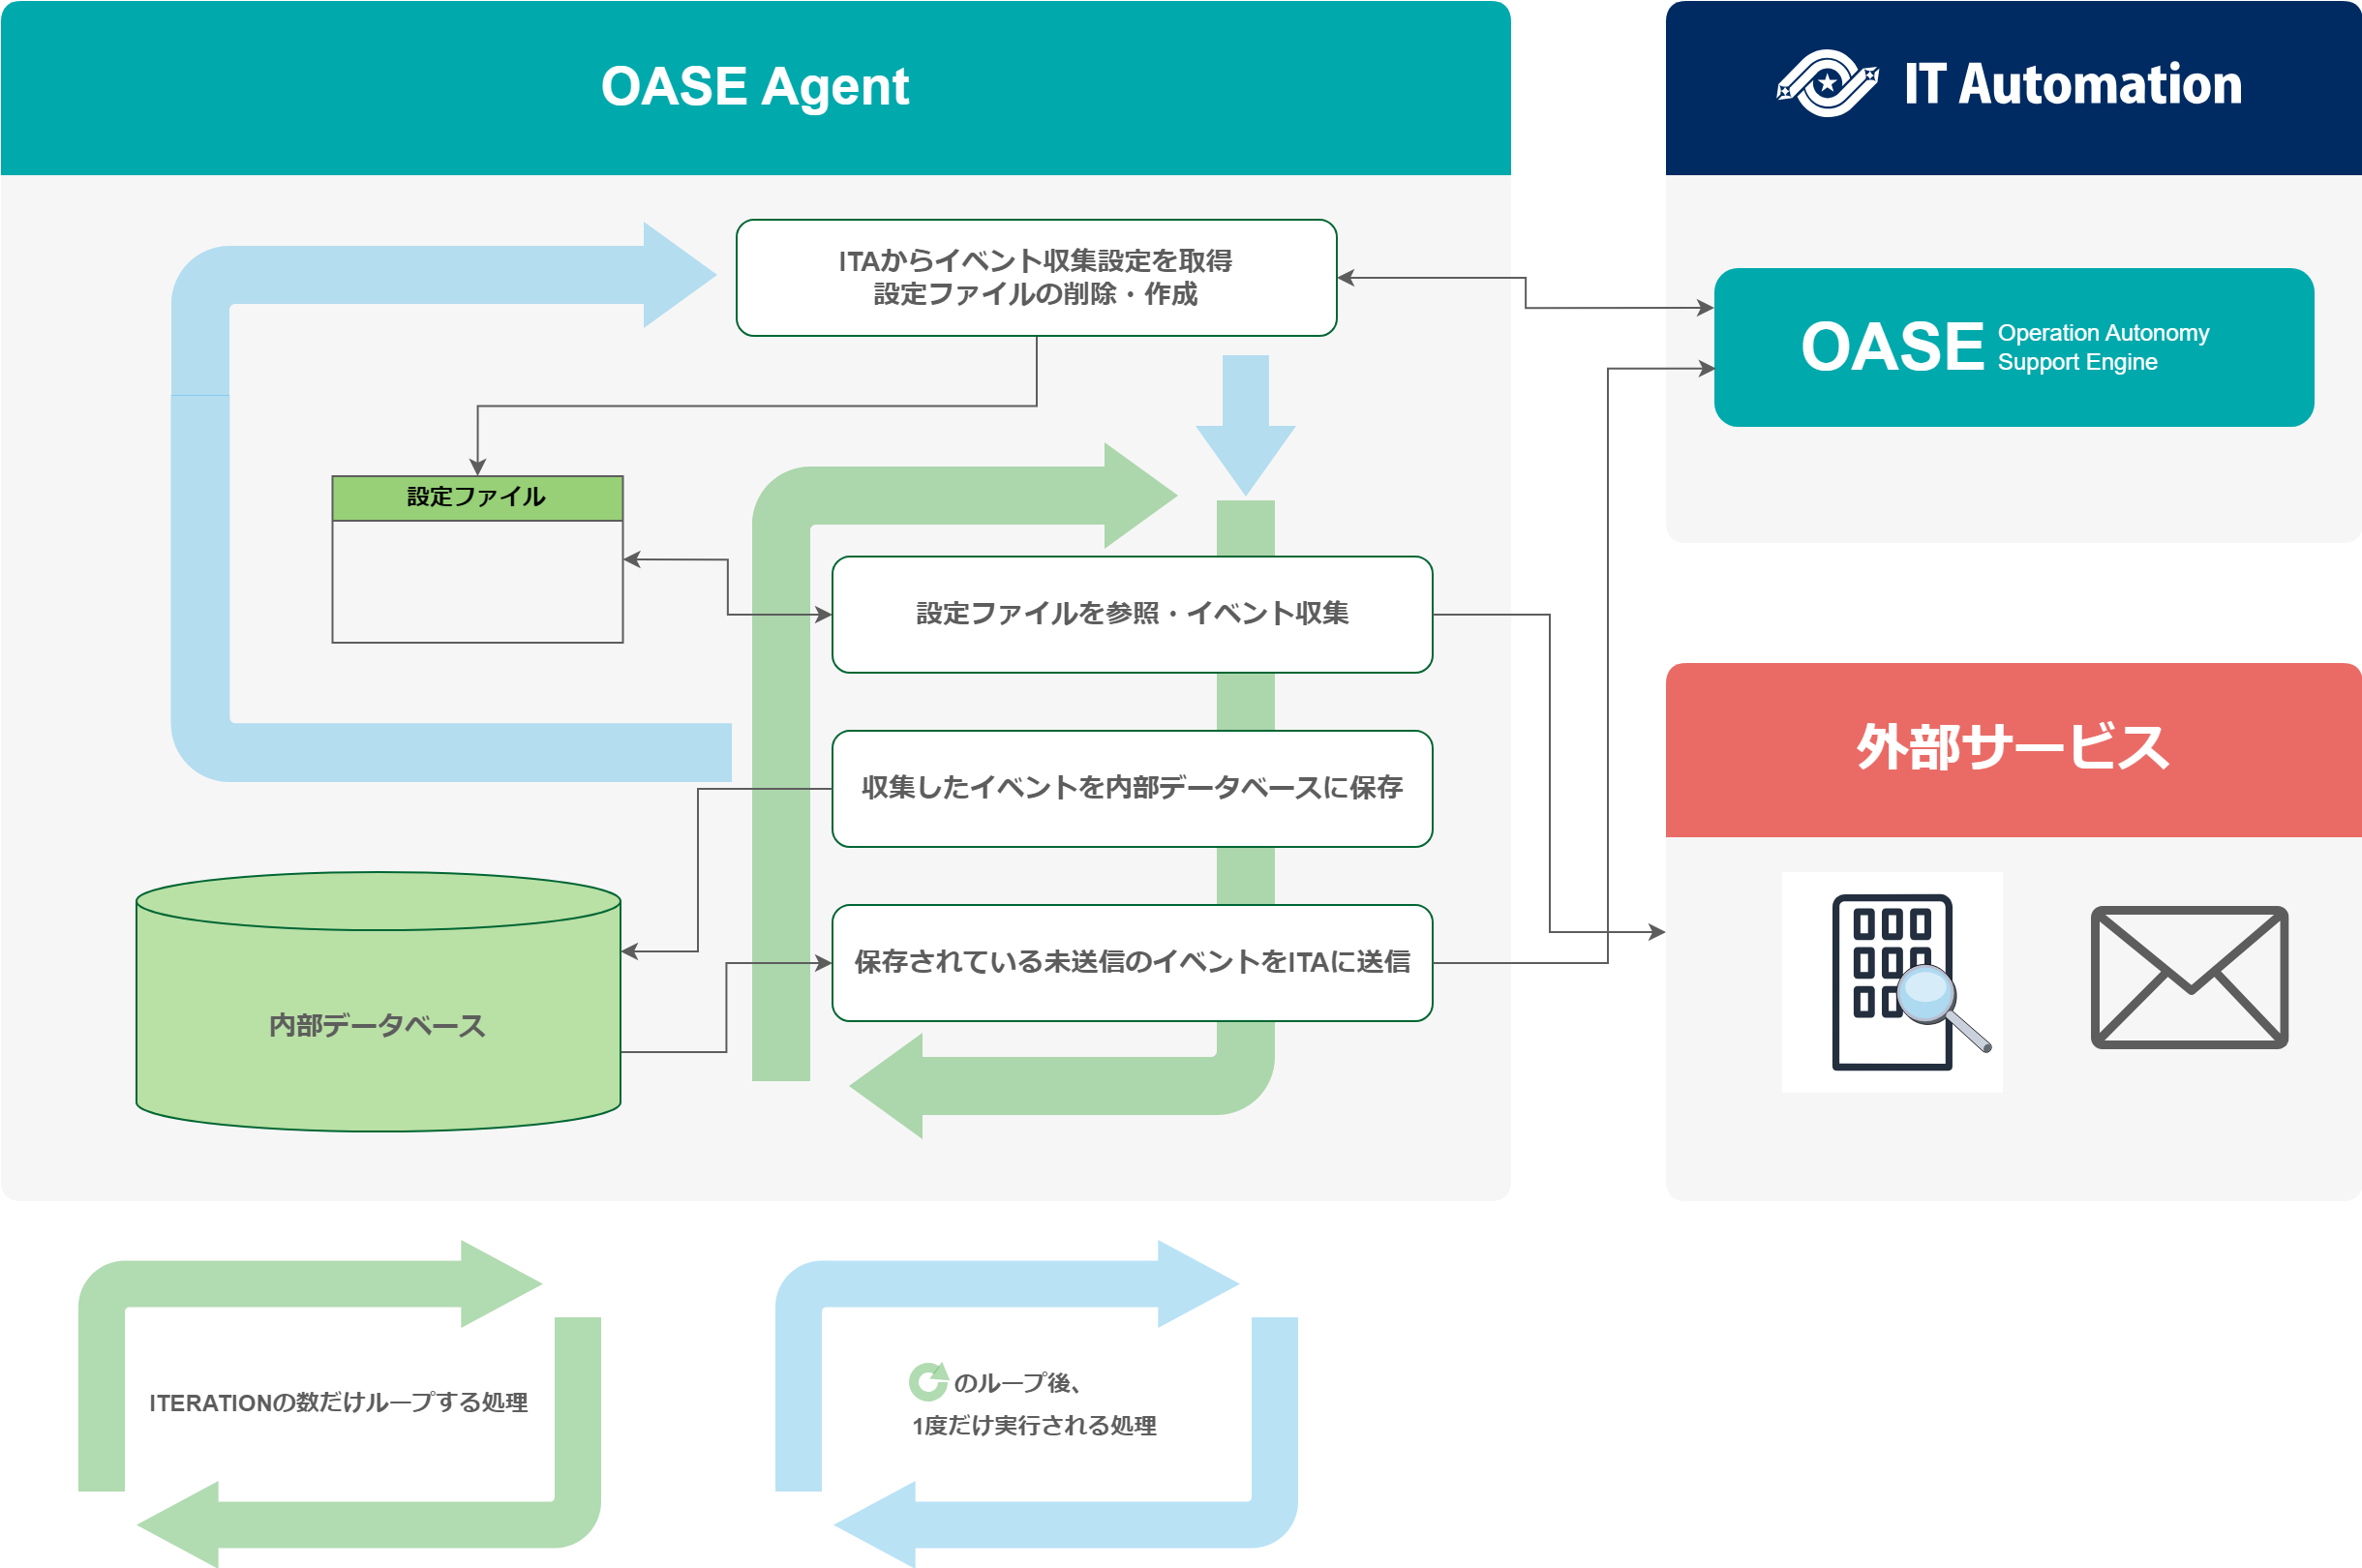
図 2.76 OASE Agent flow diagram
Parameter |
Description |
|---|---|
AGENT_NAME |
Used as the database file name and the name of the OASE Agent. |
EXASTRO_URL |
Used as the request destination when API requests are sent to ITA. |
EXASTRO_ORGANIZATION_ID |
Used to distinguish Organizations when API requests are sent to ITA. |
EXASTRO_WORKSPACE_ID |
Used to distinguish Workspaces when API requests are sent to ITA.
The specified workspace must be linked to the organization specified to EXASTRO_ORGANIZATION_ID.
|
EXASTRO_REFRESH_TOKEN |
Used as a authentication token for Bearer authentication when API requesting to ITA.
※The user's role must be able to edit the OASE - Event - Event history menu.
|
EXASTRO_USERNAME |
Used as the Basic authentication username when API requests are sent to ITA.
※The user's role must be able to edit the OASE - Event - Event history menu.
※If not using EXASTRO_REFRESH_TOKEN (Not recommended)
|
EXASTRO_PASSWORD |
Used as the Basic authentication password when API requests are sent to ITA.
※If not using EXASTRO_REFRESH_TOKEN (Not recommended)
|
EVENT_COLLECTION_SETTINGS_NAMES |
The values set to this parameter fetches event collection settings from ITA and generates a setting file. |
ITERATION |
The number of how many the processes depicted with green arrows in the figure above will loop. |
EXECUTE_INTERVAL |
The interval time for the processes depicted with green arrows in the figure above. |
2.8.2. Instant event collection settings display
- Start the OASE Agent bash shell.
docker exec -it <OASE Agent container name> bash
- Delete the setting file "event_collection_settings.json" within /tmp.
rm /tmp/event_collection_settings.json
Tip
2.8.3. Agent decoding process
Confirmed supported character codes
Transmission method |
Mail Header |
||
|---|---|---|---|
Frormat |
Language |
Content-Transfer-Encoding |
Content-Type |
plaintext |
English |
7bit |
text/plain; charset=US-ASCII |
plaintext |
Japanese |
8bit |
text/plain; charset=UTF-8 |
plaintext |
English |
8bit |
text/plain; charset="ANSI_X3.4-1968" |
html |
English |
・plaintext: 7bit ・html: quoted-printable |
multipart/alternative ・plaintext: text/plain; charset=US-ASCII ・html: text/html; charset=UTF-8 |
html |
Japanese |
・plaintext: 8bit ・html: quoted-printable |
multipart/alternative ・plaintext: text/plain; charset=UTF-8 ・html: text/html; charset=UTF-8 |
- Sending mail
- Format:plaintextContent-Transfer-Encoding:8bitContent-Type:text/plain; charset="ANSI_X3.4-1968"Subject:FailureContents:Failure:Server01\r\n
- When seen on ITA
- Subject:FailureContents:Server01\r\n
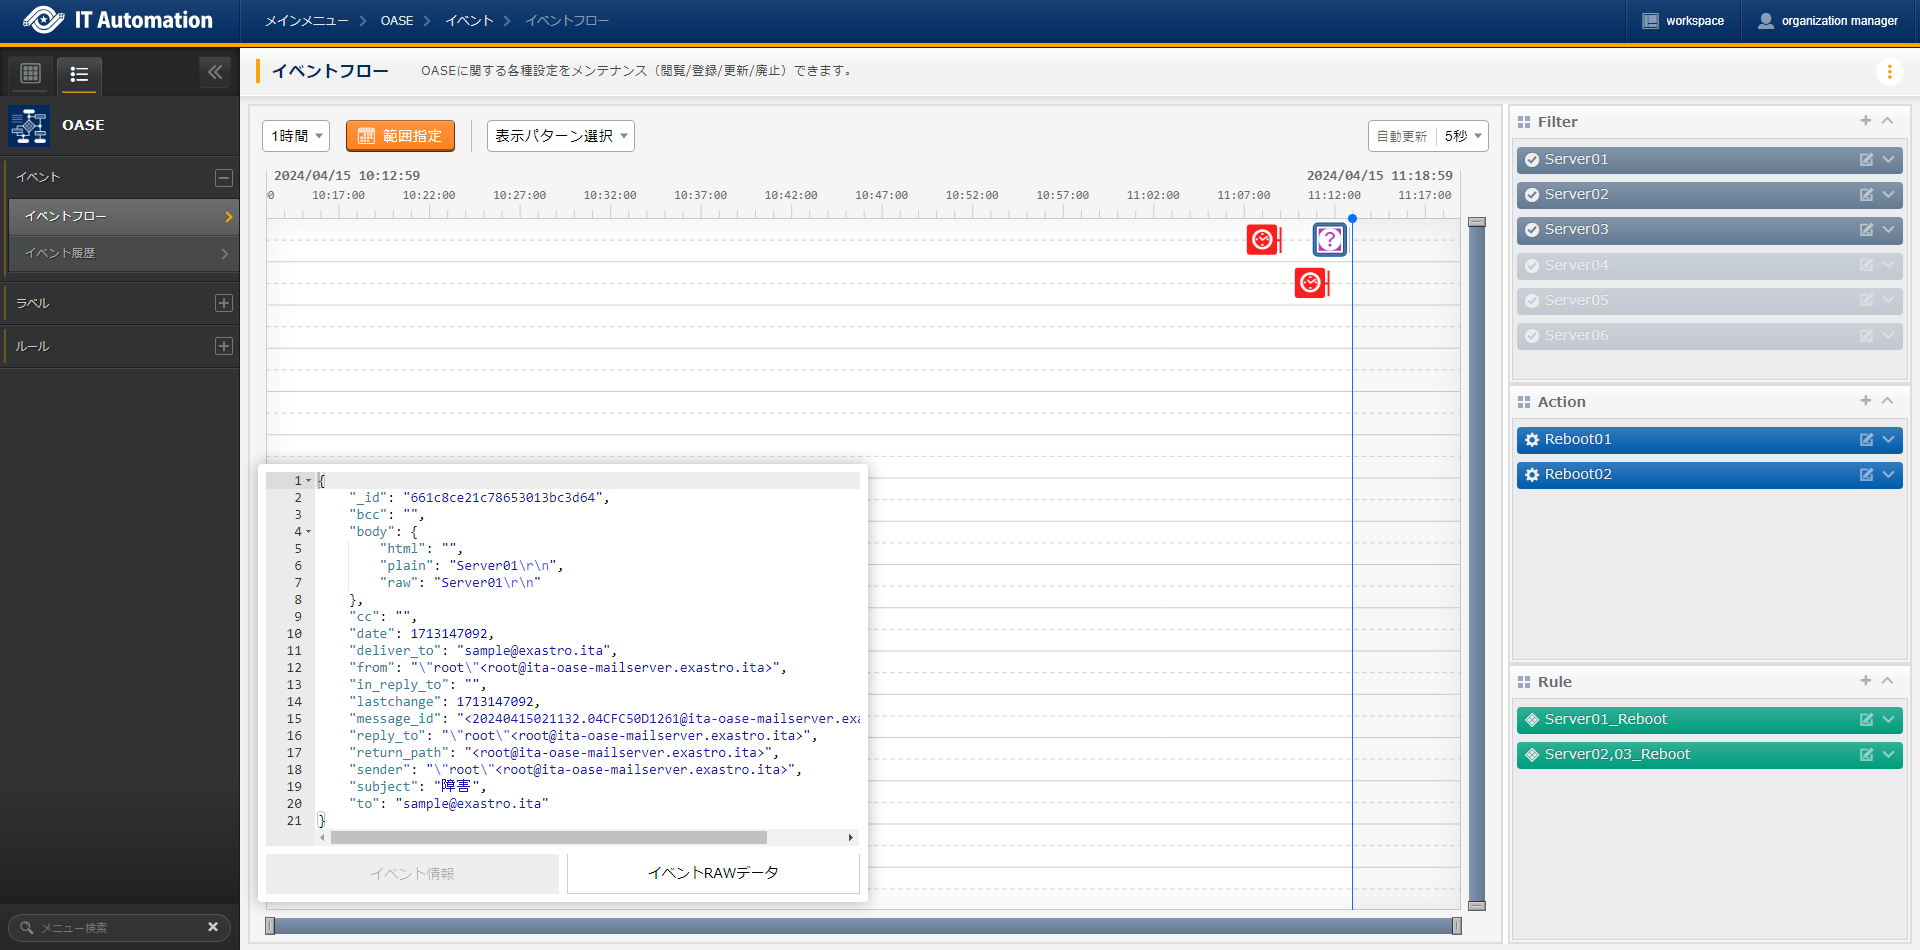
図 2.77 Collecting events without undecodable characters example/results (Event flow)
2.8.4. Response key and Event ID key
Response key
注釈
JMESPath
parent[].children
 1{
 2  "cost": 598,
 3  "timespan": "2021-04-20T09:00:00Z/2021-04-20T14:00:00Z",
 4  "interval": "PT1H",
 5  "value": [
 6    {
 7      "id": "/subscriptions/1f3・・・c38/・・・/metrics/BlobCount",
 8      "type": "Microsoft.Insights/metrics",
 9      "name": {
10        "value": "BlobCount",
11        "localizedValue": "Blob Count"
12      },
13      "displayDescription": "The number of blob objects stored in the storage account.",
14      "unit": "Count",
15      "timeseries": [
16        {
17          "metadatavalues": [
18            {
19              "name": {
20                "value": "tier",
21                "localizedValue": "tier"
22              },
23              "value": "Hot"
24            }
25          ]
26        },
27        {
28          "metadatavalues": [
29            {
30              "name": {
31                "value": "tier",
32                "localizedValue": "tier"
33              },
34              "value": "Standard"
35            }
36          ]
37        },
38        {
39          "metadatavalues": [
40            {
41              "name": {
42                "value": "tier",
43                "localizedValue": "tier"
44              },
45              "value": "Cool"
46            }
47          ]
48        }
49      ],
50      "errorCode": "Success"
51    }
52  ],
53  "namespace": "microsoft.storage/storageaccounts/blobservices",
54  "resourceregion": "westus2"
55}
注釈
- JMESPath fetching array values
value
[
  {
    "id": "/subscriptions/1f3・・・c38/・・・/metrics/BlobCount",
    "type": "Microsoft.Insights/metrics",
    "name": {
      "value": "BlobCount",
      "localizedValue": "Blob Count"
    },
    "displayDescription": "The number of blob objects stored in the storage account.",
    "//" : "・・・Sample Response line 14 ~line 49 shortened・・・",
    "errorCode": "Success"
  }
]
- JMESPath fetching objects
value[].name
[
  {
    "value": "BlobCount",
    "localizedValue": "Blob Count"
  }
]
- JMESPath fetching multiple values from deep hierarchies
value[].timeseries[].metadatavalues[].name
[
  "//" : "Line 19 metadatavalues.name"
  {
    "value": "tier",
    "localizedValue": "tier"
  },
  "//" : "Line 30 metadatavalues.name"
  {
    "value": "tier",
    "localizedValue": "tier"
  },
  "//" : "Line 41 metadatavalues.name"
  {
    "value": "tier",
    "localizedValue": "tier"
  }
]
Response list flag
Event ID key
Item name |
Setting value |
|---|---|
Response key |
value |
Response list flag |
True |
 1[
 2  {
 3    "id": "/subscriptions/1f3・・・c38/・・・/metrics/BlobCount",
 4    "type": "Microsoft.Insights/metrics",
 5    "name": {
 6      "value": "BlobCount",
 7      "localizedValue": "Blob Count"
 8    },
 9    "displayDescription": "The number of blob objects stored in the storage account.",
10    "unit": "Count",
11    "timeseries": [
12      {
13        "metadatavalues": [
14          {
15            "name": {
16              "value": "tier",
17              "localizedValue": "tier"
18            },
19            "value": "Hot"
20          }
21        ]
22      },
23      "//": "・・・ (metadatavalues are repeated and shortened) ・・・"
24    ],
25    "errorCode": "Success"
26  }
27]
Item name |
Setting value |
|---|---|
Response key |
value |
Response list flag |
True |
Event ID key |
id |
警告
Item name |
Setting value |
|---|---|
Response key |
value |
Response lsit flag |
True |
Event ID key |
value[].id |
2.8.5. Agent examples for the different monitoring softwares
警告
Zabbix
- Fetch events from Zabbix with cURL command
curl --request POST \
--url http://<Zabbix IP Address or Domain>/zabbix/api_jsonrpc.php \
--header 'content-type: application/json-rpc' \
--data "{\"jsonrpc\": \"2.0\",\"method\": \"problem.get\",\"id\": 1,\"params\": {},\"auth\": \"<Zabbix API token>"}"
 1{
 2   "jsonrpc": "2.0",
 3   "result": [
 4       {
 5           "eventid": "89",
 6           "source": "0",
 7           "object": "0",
 8           "objectid": "16046",
 9           "clock": "1709636653",
10           "ns": "906955445",
11           "r_eventid": "0",
12           "r_clock": "0",
13           "r_ns": "0",
14           "correlationid": "0",
15           "userid": "0",
16           "name": "High CPU utilization (over 90% for 5m)",
17           "acknowledged": "0",
18           "severity": "2",
19           "opdata": "Current utilization: 100 %",
20           "suppressed": "0",
21           "urls": []
22       }
23   ],
24   "id": 1
25}
注釈
- Agent settings example for fetching events from Zabbix.
Item name |
Setting value |
|---|---|
Event collection name |
<Name for fetching Zabbix faults> |
Connection method |
Free authentication |
Requestion method |
POST |
Connection destination |
http://<Zabbix IP Address or Domain>/zabbix/api_jsonrpc.php
|
Request header |
{ "content-type" : "application/json-rpc" }
|
Parameter |
{
  "jsonrpc":"2.0",
  "method":"problem.get",
  "id":1,
  "params":{},
  "auth":"<Zabbix API token>"
}
|
Response key |
result |
REsponse list flag |
True |
Event ID key |
eventid |
注釈
- Sign in to Zabbix as an admin through the browser.The default admin login inforamtion are as following:・Username: Admin・Password: zabbix
- Select a user Side menu > User
- Click Create user at the top right part of the user page.
- Input username and password
- Click the Permission tab
- Go to the user role and click Select select.Select a "User role" or a role that has more API access.
- Input other required items
- Click Add.
curl --request POST \
--url ttp://<Zabbix IP Address or Domain>/zabbix/api_jsonrpc.php \
--header "Content-Type: application/json-rpc" \
--data "{\"auth\":null,\"method\":\"user.login\",\"id\":1,\"params\":{\"user\":\"<Username>\",\"password\":\"<Password>\"},\"jsonrpc\":\"2.0\"}" \
1{
2    "jsonrpc": "2.0",
3     "result": "<Zabbix API token>",
4     "id": 1
5}
Grafan
- Fetch events from Grafan with cURL command.
curl --request GET \
--url 'http://<GrafanaのIP addres か Domain>:3000/api/prometheus/grafana/api/v1/alerts' \
--header 'authorization: Bearer <Authentication token>' \
--header 'Content-Type: application/json'
 1{
 2    "data": {
 3        "alerts": [
 4            {
 5                "activeAt": "2018-07-04T20:27:12.60602144+02:00",
 6                "annotations": {},
 7                "labels": {
 8                    "alertname": "my-alert"
 9                },
10                "state": "firing",
11                "value": "1e+00"
12            }
13        ]
14    },
15    "status": "success"
16}
注釈
- Event collection settings example for fetching events from Grafana.
Item name |
Setting value |
|---|---|
Event collection name |
<Name for fetching Grafana alerts> |
Connection method |
Bearer authentication |
Request method |
GET |
Connection destination |
http://<Grafana IP addres or Domain>:3000/api/prometheus/grafana/api/v1/rules
|
Request header |
{ "Content-Type": "application/json" }
|
Authentication token |
<Authentication token> |
Response key |
data.alerts |
Response list flag |
True |
Event ID key |
activeAt |
注釈
- Log in to Grafan through the browser.The default values are as following:・username: admin・Password: admin (Might have been changed if someone already has logged in)
- Select Home > Administration > Service accounts
- Click service account and create a service account.
- Input a name for the service name (uncapitalized alphanumeric characters only).
- Click Add service account token and create an Authentication token.
- For expiration,Select either "No expiration" (no period ※recommended) or"Set expiration" (with period).
- Click Generate token.
- Click Copy to clipboard and closeand paste the Authentication token to the clipboard.
- Paste the Authentication token from the clipboard to 's .